Share
- Jump to:
25 Catering Statistics You Need to Know in 2024
Catering saw a massive rebound in 2023, particularly in corporate and office catering. In this article, we break down the industry's growth, challenges, and consumer behavior. Join us as we delve into 25 need-to-know catering statistics to help build your growth strategy in 2024.
Catering Market Growth & Tech Insurgence:

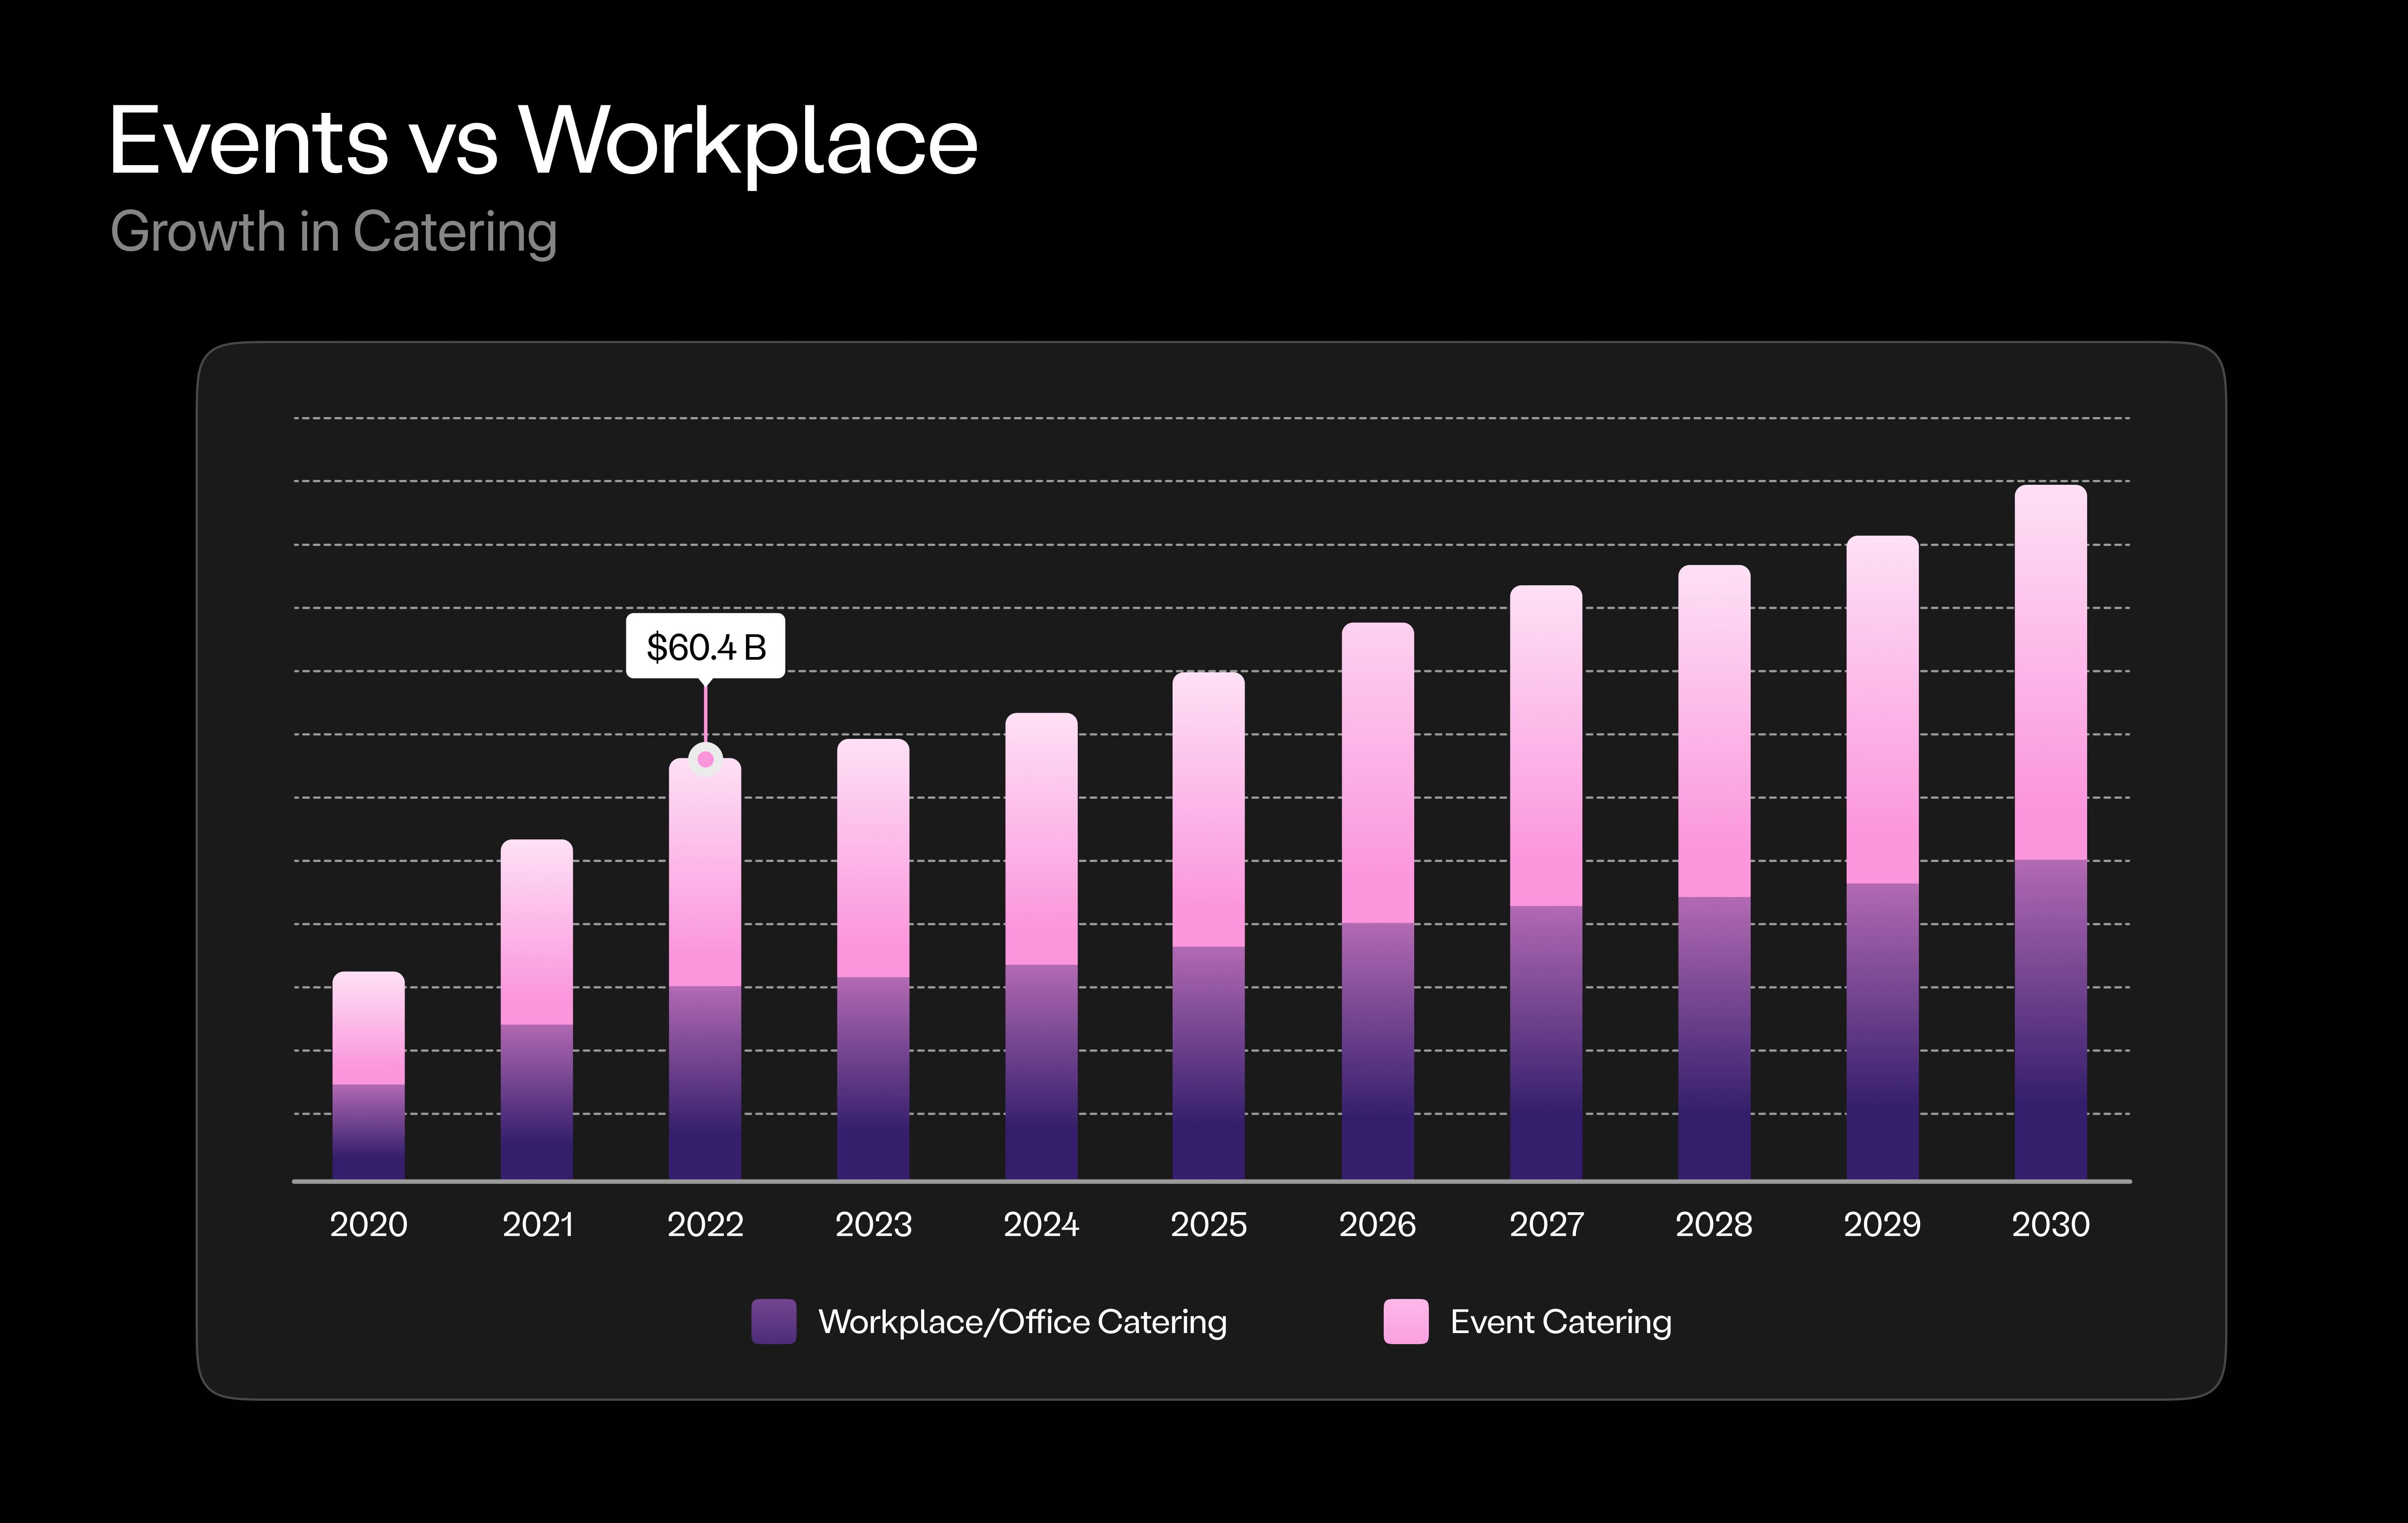
The catering market reached a value of USD 72.67 billion in 2023.
The catering market is anticipated to grow at a compound annual growth rate of 6.2 percent, reaching $124.36 billion by 2032.
63% of the catering business is made up of catering to customers, commonly known as B2C or social catering.
The key trends driving growth in catering are the increasing incorporation of technology, the rising popularity of food outsourcing at parties, and a growing variety of catering menu options
Regarding catering operations and investments, we asked Enterprise restaurants what area of their catering business is top of mind this year, and the top response was 30.3% in order management tech, followed by 21.2% in generating demand.

Growing demand for the following applications around the world has had a direct impact on the growth of Catering and Food Services: medical institutions, education institutions, government organizations, and commercial catering.
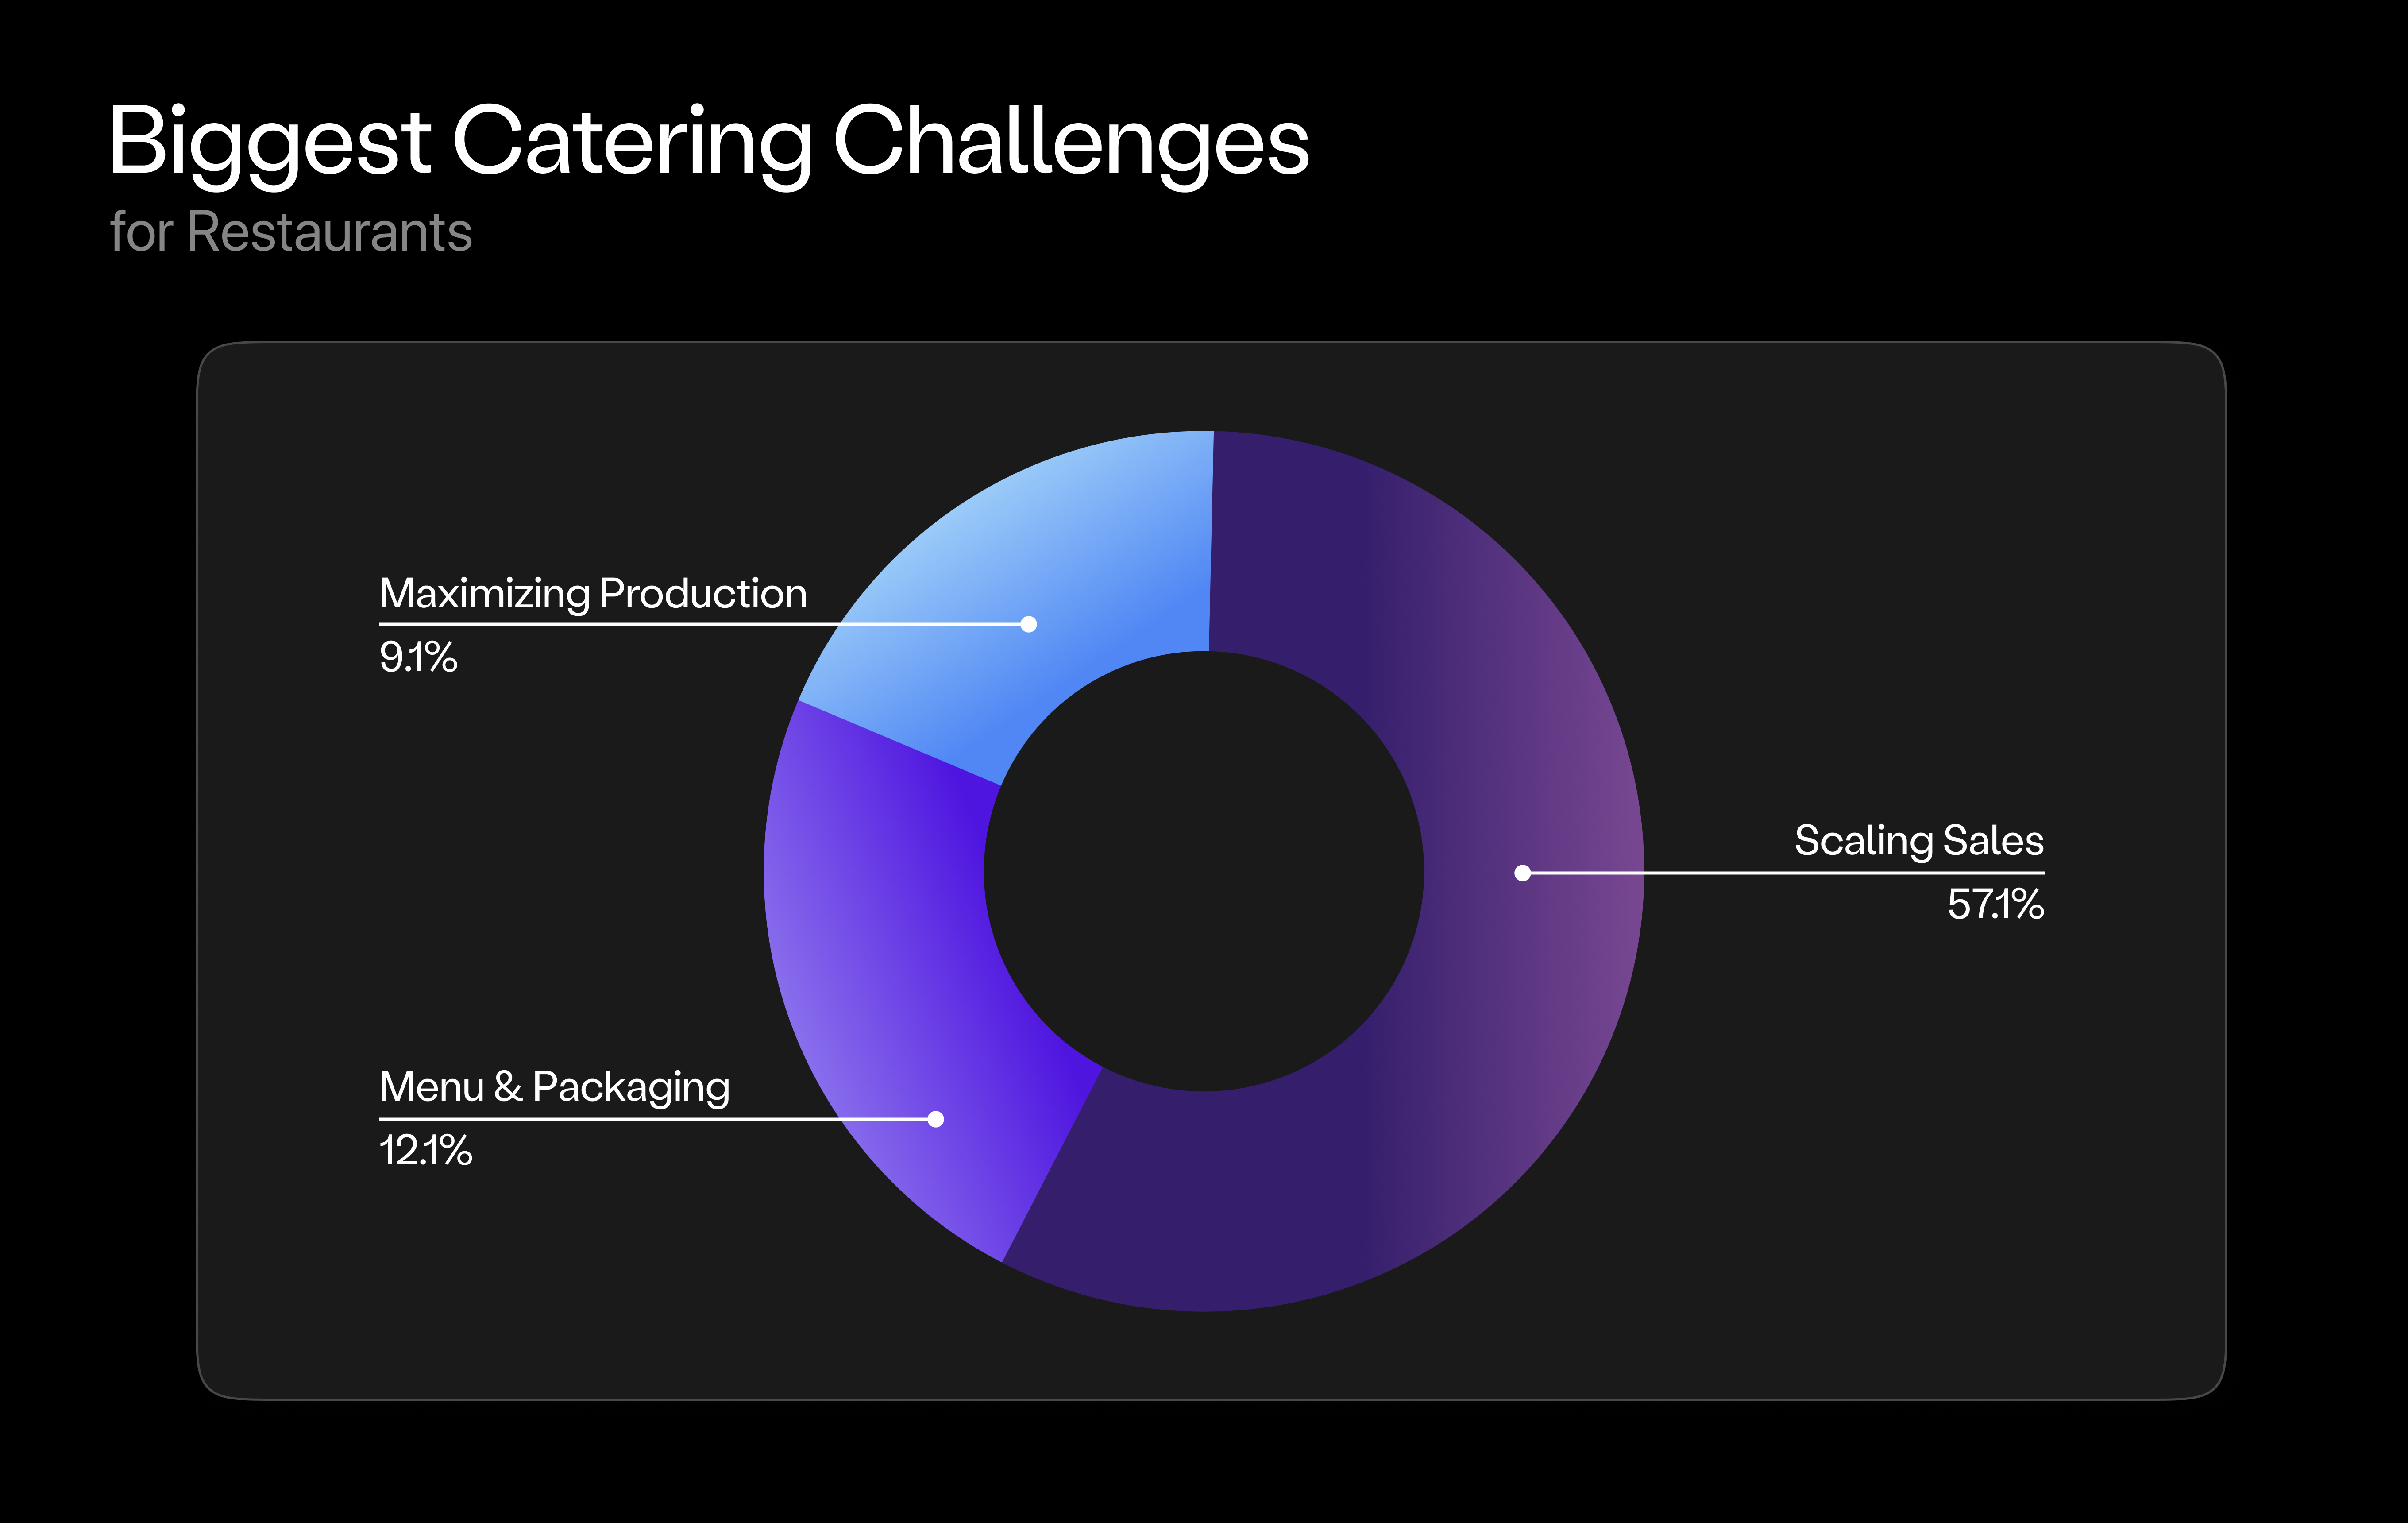
In a recent survey by Lunchbox, restaurants were asked what areas of catering they found the most challenging. The top result was scaling sales at 57%, followed by menu and packaging.

The entire revenue for the food service business was $537.2 billion last year, meaning that catering accounted for 11% of the market.
Catering to consumers (also called B2C or social catering) makes up 63% of the total catering market, according to Technomic. B2B catering and serving institutions account for the other 37%.
Investing in a direct catering online channel has a 9X ROI after the first 12 months (Lunchbox).
Lunchbox Catering channels cost restaurants 82% less than third-party marketplaces after one year.
Consumer Ordering Trends:

Consumers are spending the most money on QSR and full-service catering services. 37% of catering dollars are spent at QSR restaurants, while 25% are spent at full-service establishments.
The top decision influencers when corporate customers order catering are: quality & taste, and order accuracy.
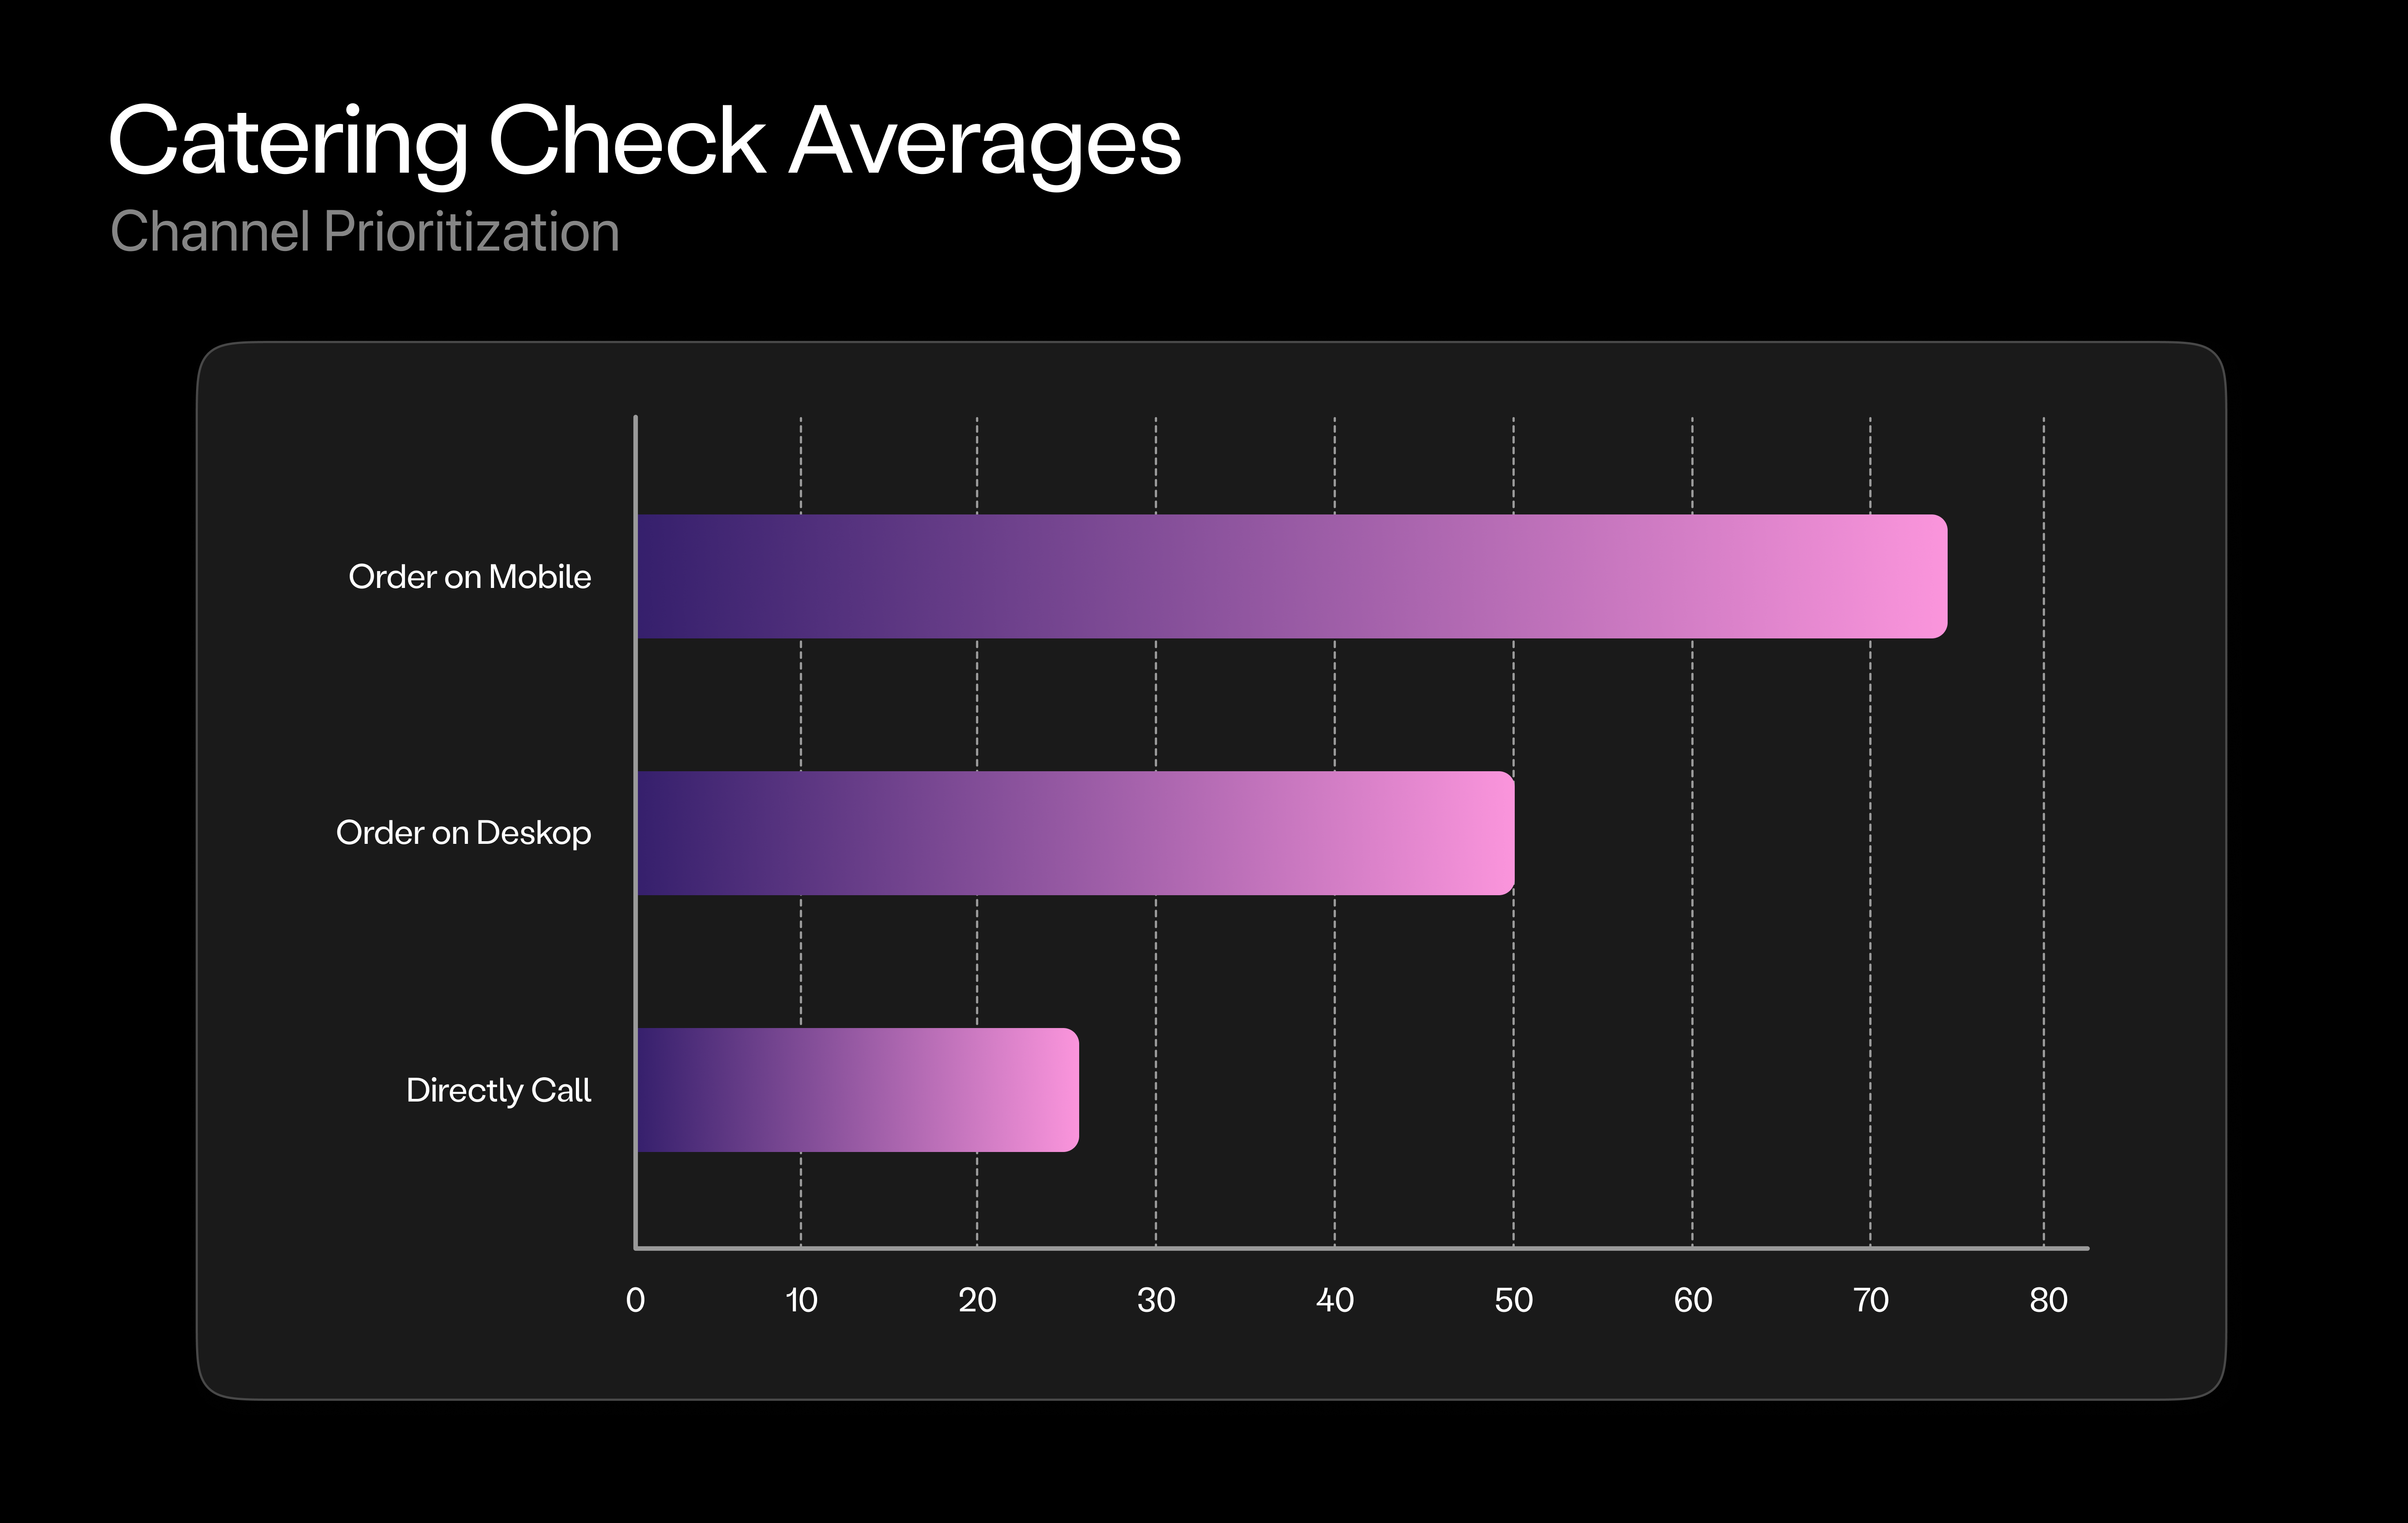
Catering check averages are higher on first-party online ordering than marketplace online ordering, with Lunchbox Catering orders averaging at $500 per check.
The majority of catering orders (75%) are placed online on mobile or desktop. Phone calls still make up a 30% portion of catering orders.

The Corporate Catering Landscape:

Catering is a strong motivation factor for about 65% of employees to head into the office.
Over 80% of company budgets for food orders have either remained the same (55%) or increased (28%) since the pandemic.
Almost 80% of companies frequently order business catering—at least once a month. And of those companies, 32% order weekly.
Corporate events, such as office parties and staffed events, were reported as the largest area of growth by 48% of caterers.
The percentage of people working remotely declined from 26% in 2022 to 23% in 2023.
Food at Work, or B2B office catering, is expected to grow at a CAGR of 8.8% between 2023 and 2030.
40% of businesses that order catering request food for over 20 people.
The average business catering order serves over 20 people.
70% of catering orders occur during off-peak business hours.
Wrapping Up:
As we conclude our exploration of catering in 2024, it's clear that the industry is ripe with opportunities for growth and innovation. From the impact of technology to changing consumer behaviors, there's much to consider for those operating in this space. By staying informed and adapting to these trends, businesses can position themselves for success in the evolving world of food services.